Visualizing output with igm_viz
igm_viz is a Plotly/Dash app that renders a run's output as an interactive 3-D animation — glacier surface and bedrock, colored by any saved variable, steppable frame by frame or played back automatically. This tutorial walks through the app using the Aletsch forward-modelling tutorial output as an example.
Setup
Run it from the same folder you ran igm_run in — it looks for output.nc under outputs/*/*/ by default:
This opens a local web app at http://127.0.0.1:8050.
If your outputs/ folder isn't in the current directory, point igm_viz at it directly:
The exact netCDF file to view is always picked afterward in the dashboard itself.
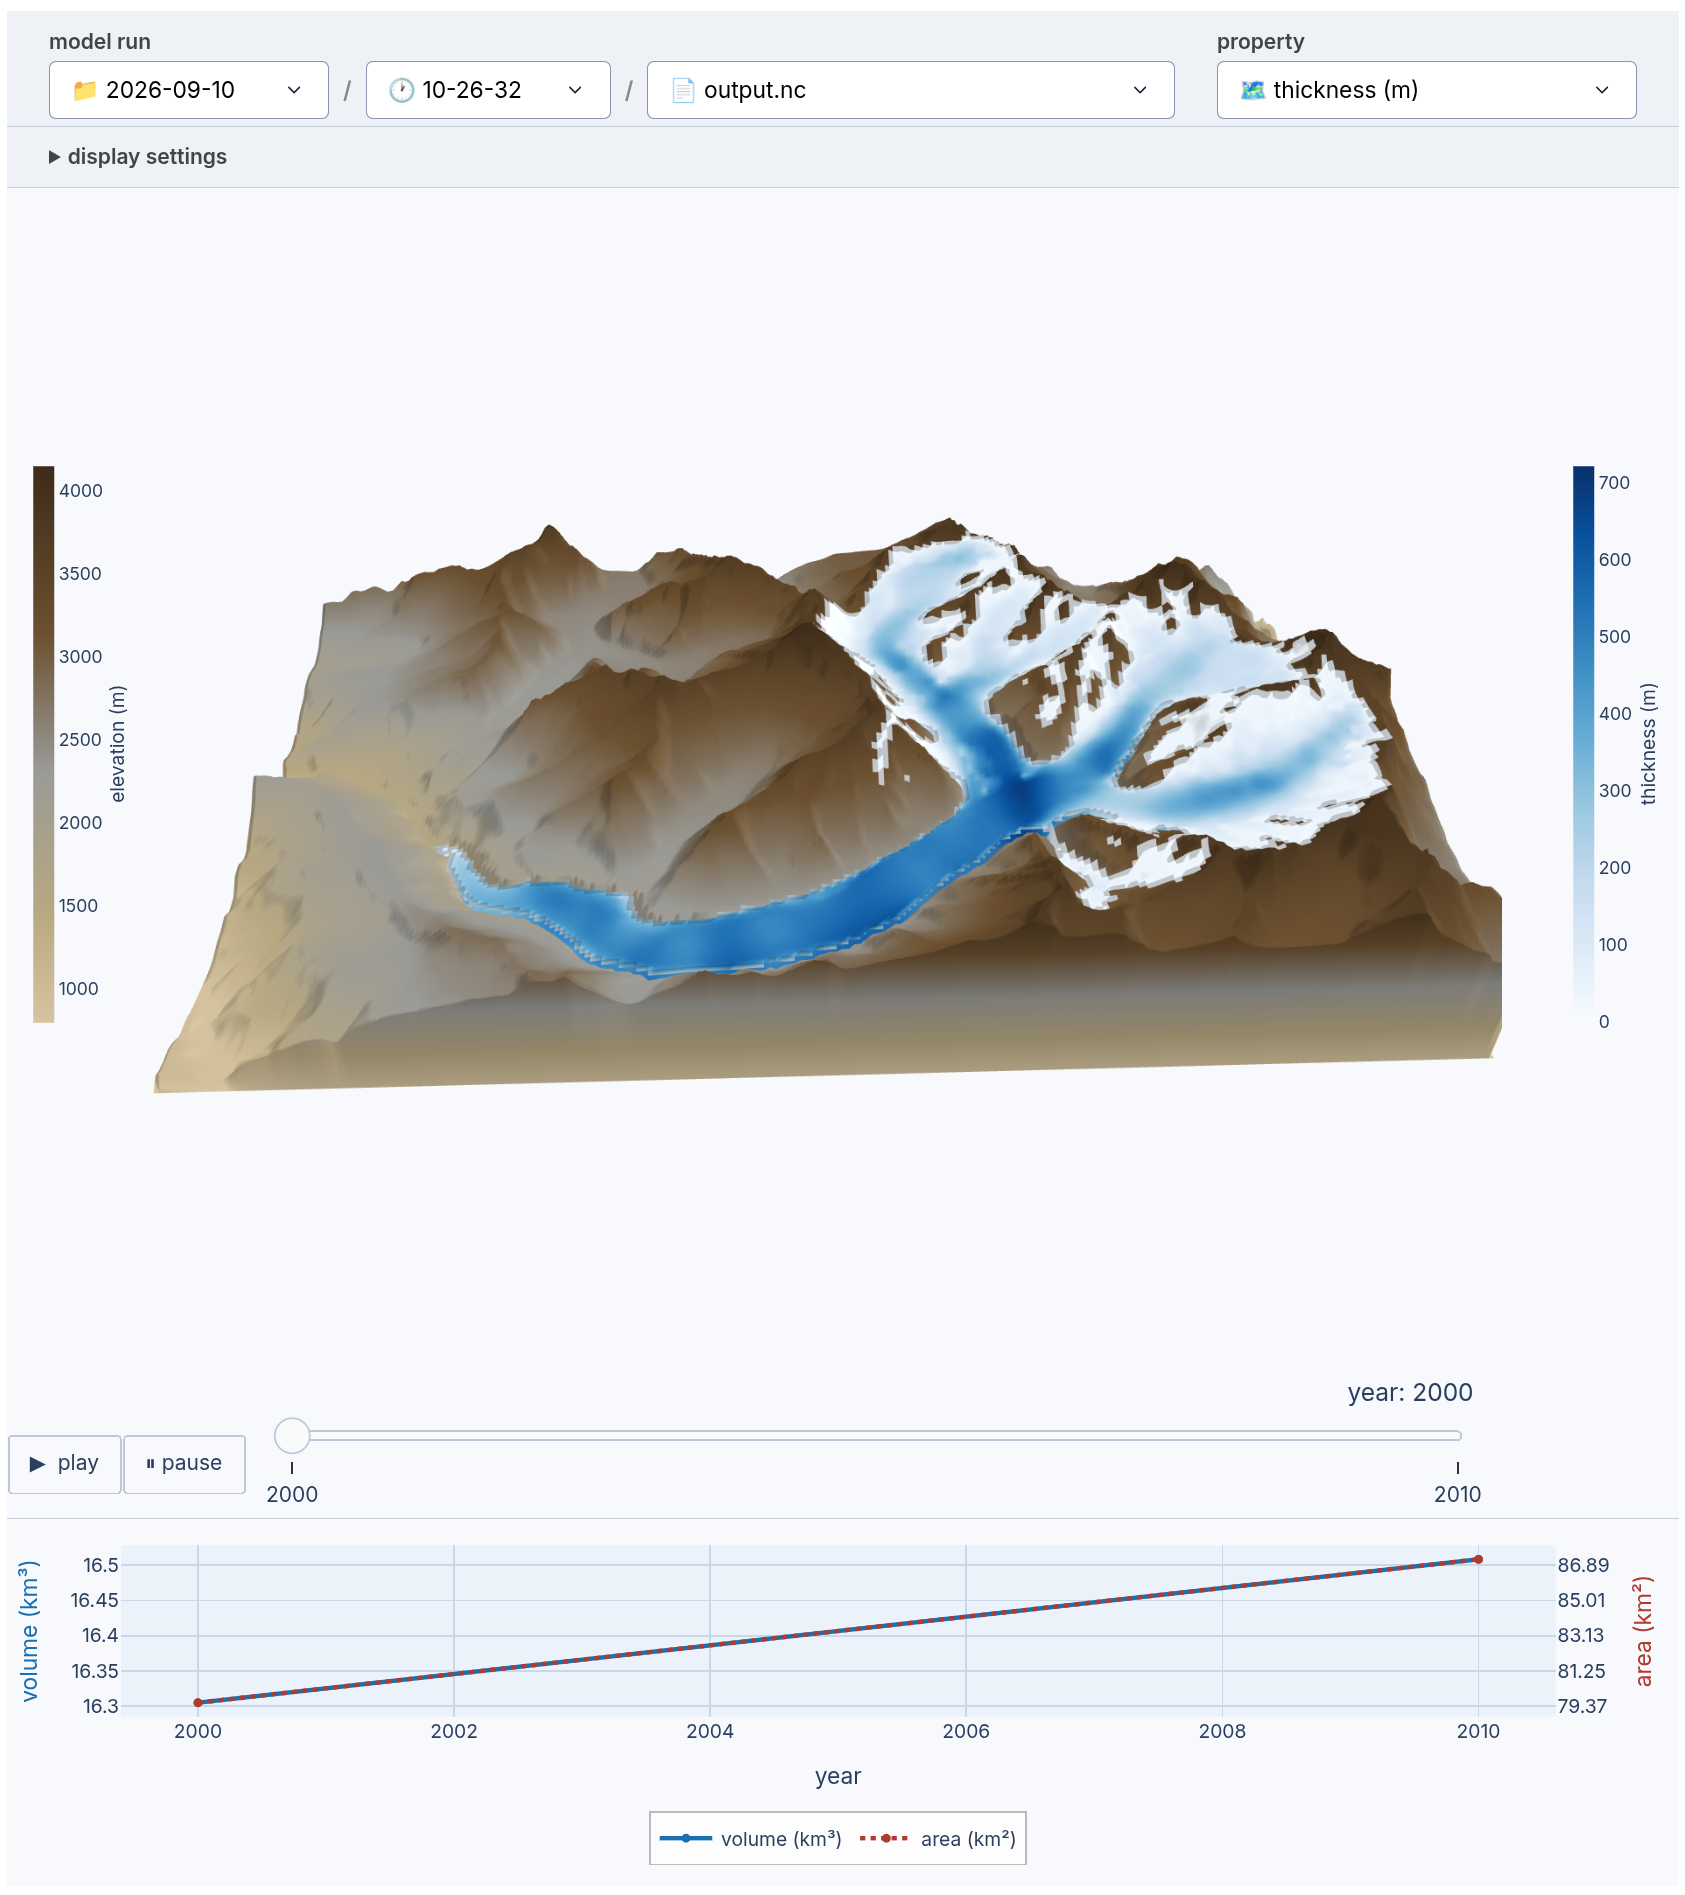
Picking a run and a property
Every past run found under outputs/*/*/ is listed in the model run picker at the top, so you can switch between runs without restarting the app. The property dropdown selects which variable colors the glacier surface — thickness, velocity, SMB, sliding coefficient, or any other 2-D+time field saved in the output.
Adjusting the view
- Vertical exaggeration and glacier opacity sliders adjust the 3-D rendering.
- Ocean plane and calving front checkboxes add a sea-level plane and vertical ice walls where the glacier meets open ocean.
- Colorbar range can be clamped manually instead of scaling to the data's min/max.
Animating and statistics
Step through frames with the slider at the bottom of the 3-D view, or hit play to animate. Below the 3-D view, a stats panel tracks glacier volume and area over time (or over iterations, for data-assimilation output).
Data-assimilation output
igm_viz also reads data-assimilation outputs (optimize.nc, geology-optimized.nc), deriving bedrock elevation from usurf - thk when topg isn't saved. Pick one from the model run picker like any other file — no separate flag needed.
Next steps
- Run the tutorial that produced this output: Aletsch forward modelling
- Recover a spatial field to visualize: Ice-thickness inversion